

50 Warehouse KPIs to Measure Performance
Warehouse performance can look fine on the surface while small problems keep piling up, such as slow picks, missed orders, and wasted labor. The right warehouse KPIs help you catch those issues early, cut waste, improve speed, and keep customers happy.
This post covers 50 KPIs grouped by area, so you can focus on the numbers that matter most to your operation. Not every warehouse needs to track every KPI every day, and the best results often come from a tight set of measures reviewed often, like the ones used in warehouse efficiency and fulfillment metrics.
Why warehouse KPIs matter more than gut feel
A warehouse can look busy and still miss the mark. People are moving, pallets are shifting, and orders are flying out the door, yet costs stay high and errors keep slipping through. That is why warehouse KPIs matter more than gut feel, they turn daily activity into clear proof of what is working and what is not.
Good metrics show the difference between motion and progress. They help leaders spot problems early, assign labor with more confidence, and keep service levels steady when demand changes.
What KPIs reveal that floor activity cannot
Floor activity only shows effort. KPIs show results.
A picker can walk miles and still move slowly if routes are poor or inventory locations are messy. A dock can stay packed with activity while shipments still leave late. Numbers make those gaps visible, especially when a warehouse feels productive on the surface.
KPIs also expose issues that are easy to miss in the moment:
- Slow picking can hide inside a busy shift when the team is moving but not finishing orders fast enough.
- Inventory errors show up in cycle count variance, order shorts, and avoidable rework.
- Poor space use appears when storage fills up unevenly or travel time keeps rising.
- Late shipments reveal bottlenecks at packing, staging, or dock scheduling.
Busy does not always mean efficient. A team can stay active all day and still waste time on poor layout, wrong stock placement, or repeated touches on the same order. That is why performance needs numbers, not just observation.
For a closer look at accuracy-related measures, fulfillment accuracy best practices can help connect the dots between picking mistakes and customer impact.

### How the right metrics support faster decisions
The best warehouse KPIs do more than fill a report. They help leaders act before small problems spread.
When order cycle time starts slipping, you can shift labor, change pick paths, or review packing steps right away. When inventory accuracy drops, you can tighten counts before the errors turn into missed shipments. When dock turnaround slows, you can adjust staging or inbound timing before the backlog grows.
That kind of visibility supports better labor planning too. Instead of staffing by instinct, managers can match headcount to actual demand patterns, peak hours, and task mix. In other words, they can place the right people in the right spots before the shift gets off track.
KPIs also help you separate a one-day issue from a real trend. A single delay might be noise, but repeated delays in the same process point to a bottleneck that needs attention. That is where warehouse performance data becomes useful for real improvement, not just reporting.
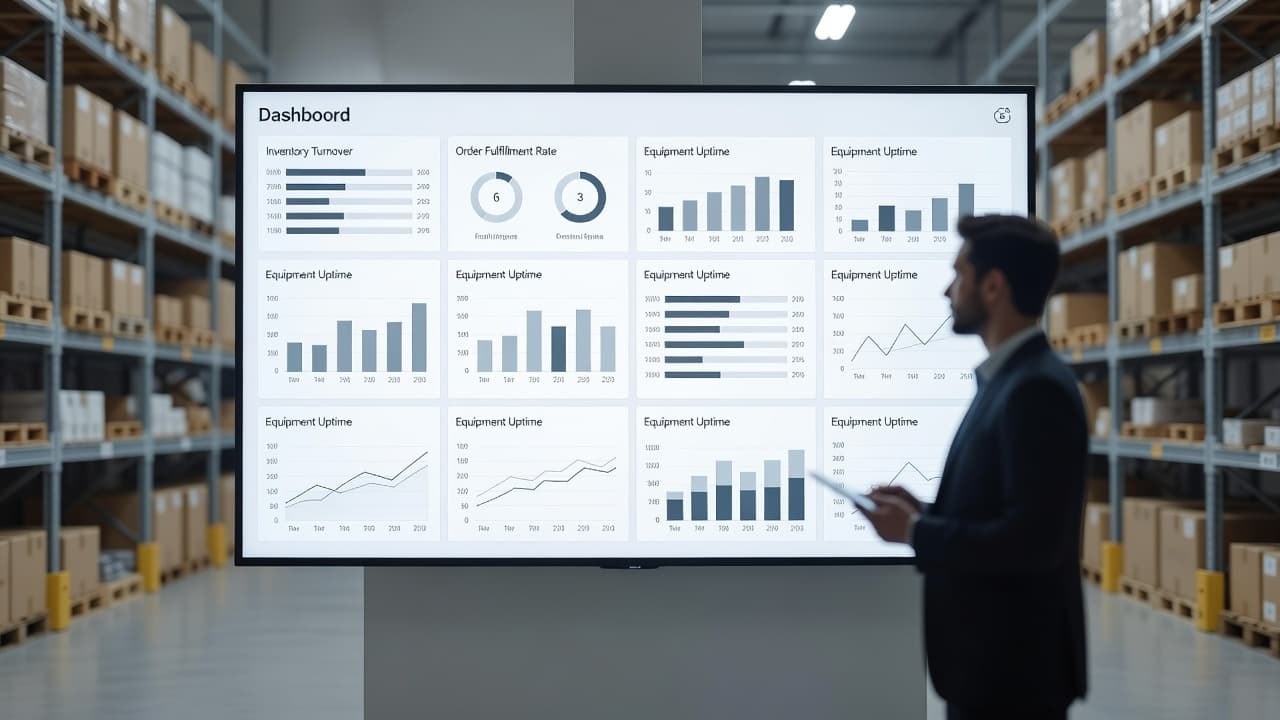
A good dashboard does not just describe the week. It tells you where to act today.
The cost of tracking too much or too little
Too many metrics can bury the real story. Teams end up watching vanity numbers, like total scans or units moved, while the actual pain points stay hidden. Too few metrics create the opposite problem, because leaders miss early signs until service slips or costs rise.
A practical KPI set keeps the focus on what drives performance:
- Service levels, so customers get orders on time and in full.
- Labor productivity, so staffing matches output.
- Inventory control, so stock stays accurate and usable.
- Cost management, so waste does not eat into margin.
The key is consistency. Track a few core measures often, then use deeper metrics when one area needs attention. That approach keeps reports useful and helps leaders make decisions that stick.
The core warehouse KPIs every operation should watch first

The strongest warehouse KPI set starts with a few basics that tell the truth fast. If these numbers are off, almost every other report loses value.
That is why the first metrics to watch are the ones tied to stock accuracy, order quality, shipping speed, labor, and space use. These measures show whether the warehouse is keeping up with demand or hiding small problems that will grow later.
Inventory accuracy and inventory record accuracy
Inventory accuracy tells you whether the stock on the floor matches what the system says you have. Inventory record accuracy looks at the same idea from the data side, and both matter because a warehouse runs on trust in its numbers.
When counts are wrong, the impact shows up fast. A product may look available in the system but be missing on the shelf, which creates stockouts, backorders, and upset customers. The opposite problem is just as costly, because extra stock sits too long, ties up cash, and makes planning less reliable.
Poor accuracy also throws off purchasing, labor plans, and replenishment. If the system says one thing and the floor says another, managers start guessing. That is how small count errors turn into bad forecasts and bloated inventory.
If the record is wrong, every downstream decision gets less useful.
For many operations, this is the KPI to tighten first. Once your inventory data is dependable, cycle counts, replenishment, and order promises all get easier to manage.
Order accuracy, pick accuracy, and ship accuracy
These three KPIs show how often the right item, quantity, and shipment reach the customer. They sit close to the customer experience, so even a small miss can create a big problem.
Pick errors lead to short shipments, wrong items, and extra touches in the warehouse. Shipping errors add another layer of cost because a mistake at the dock can trigger returns, replacement orders, and service calls. Each error also chips away at trust, which is hard to win back once a customer has to complain twice.
The labor cost adds up too. A wrong pick does not end when the carton leaves the building, because someone still has to fix the order, print labels, answer questions, and restock the item if needed.
If you want to reduce rework, start by tracking where mistakes happen most often. Many teams use reducing warehouse mispick rates as a practical way to connect picking controls with better fulfillment results.
A simple way to think about these KPIs is this:
- Pick accuracy shows whether the right item left the location.
- Order accuracy shows whether the full order was assembled correctly.
- Ship accuracy shows whether the right order reached the right destination.
On-time shipment and dock-to-stock time
On-time shipment measures whether orders leave when promised, which has a direct effect on service levels. If the warehouse misses the cutoff, the customer feels it right away.
Dock-to-stock time tracks how long it takes to receive goods, inspect them, and make them available for use. Shorter dock-to-stock times keep inventory moving and help the rest of the operation stay balanced. Longer delays create backlogs at receiving and leave stock unavailable when the team needs it.
Speed matters at both ends of the warehouse. A fast dock keeps inbound flow clean, while a reliable shipping process keeps outbound flow steady. When one side slows down, the other side feels the pressure almost immediately.
A warehouse that watches these KPIs can spot bottlenecks before they spread. For example, delayed putaway may look small at first, but it often turns into missed picks later in the week.
Labor productivity and space utilization
Labor productivity shows how much useful work the team completes in a shift. Space utilization shows how well the warehouse uses its storage area, rack space, and floor space.
Both matter because a warehouse can look busy and still fall short. Workers may walk too far, search too long, or handle the same pallet more than once. At the same time, poor slotting can leave prime storage space underused while overflow areas fill up too soon.
Good labor numbers help managers assign work with more accuracy. Good space numbers help them decide whether the issue is staffing, layout, or storage design. Together, they give a clearer picture of where the operation is losing time and money.
A simple comparison helps here:
| KPI area | What it tells you | Common warning sign |
|---|---|---|
| Labor productivity | How much output the team produces | High hours with low completed orders |
| Space utilization | How much storage capacity is in use | Packed aisles or empty prime locations |
When both metrics are in range, the warehouse usually runs with less waste and fewer surprises. When either one slips, the root cause is often hiding in workflow, slotting, or storage strategy.
KPI categories that make the full dashboard easier to manage
A long list of warehouse KPIs can turn into noise fast. Grouping them by function keeps the dashboard readable and makes it easier to spot what needs attention first. It also helps leaders separate leading indicators, which warn about future issues, from lagging indicators, which show the result after the work is done.
That mix matters. Leading metrics help you act early, while lagging metrics confirm whether the fix worked. A strong dashboard uses both, so you can see the condition of the operation now and the risk building behind it.
### Receiving and putaway metrics
Receiving metrics show how quickly inbound freight moves into usable inventory. Putaway metrics show how well the warehouse places stock where it belongs, which affects every later step.
Start with dock-to-stock time, receiving accuracy, and putaway cycle time. These KPIs tell you whether goods are arriving cleanly, being checked correctly, and reaching storage without delay. If these numbers slip, the rest of the warehouse feels it through stockouts, congestion, and missed picks.
A few common measures belong in this group:
- Receiving accuracy tracks whether item counts and labels match the purchase order.
- Dock-to-stock time shows how long inventory sits before it becomes available.
- Putaway cycle time measures how fast teams move product from dock to storage.
- Inbound backlog flags how much work is waiting at receiving.
These are useful early-warning metrics. If dock-to-stock time rises, the issue may be staffing, inspection delays, or poor slot availability. If receiving accuracy falls, you may need tighter checks at the dock or better supplier controls.
For many teams, this is also where ecommerce fulfillment centers provide a helpful benchmark, because inbound flow sets the pace for the whole operation. When receiving runs well, downstream tasks usually run with less friction.
Storage and inventory control metrics
Storage and inventory control metrics keep stock healthy after it is put away. They show whether the warehouse knows what it has, where it is, and how well it protects that inventory.
The key KPIs here include inventory accuracy, cycle count accuracy, replenishment rate, slotting utilization, and shrinkage. Together, they show whether the warehouse is holding the right stock in the right place without losing value along the way.

If inventory accuracy drops, every order promise gets shakier. If shrinkage rises, the problem may come from damage, theft, miscounts, or poor handling. Slotting and replenishment matter too, because good placement reduces travel time and prevents pick faces from running empty.
This group is best watched with a balance of leading and lagging measures. Slotting utilization and replenishment rate hint at future performance, while shrinkage and inventory accuracy show what already happened. That mix helps managers correct problems before they spread into service issues.
A simple dashboard layout can help here:
| Metric type | What it tells you | Why it matters |
|---|---|---|
| Leading | Slotting utilization, replenishment rate | Shows future risk before stock runs thin |
| Lagging | Inventory accuracy, shrinkage | Confirms whether control actually held up |
When these numbers stay healthy, inventory becomes easier to trust. That trust saves time in planning, counting, and customer service.
Picking, packing, and shipping metrics
Outbound metrics usually get the most attention because they affect the customer directly. They tell you how fast the warehouse turns inventory into orders, and how often those orders leave correctly.
The main KPIs in this group are pick accuracy, pick rate, order cycle time, packing accuracy, shipping accuracy, and on-time shipment. You can also add order lines picked per hour or perfect order rate if you want a broader view of outbound quality.
These measures work together. Pick rate shows speed, but accuracy shows discipline. Packing and shipping metrics reveal whether the order stayed correct after picking. Order cycle time ties it all together by showing how long the customer waits from order release to shipment.
Fast outbound work only helps when the order is still right at the end.
When one of these numbers slips, look for the bottleneck first. It may be a poor pick path, slow packing stations, label errors, or dock congestion. In many warehouses, fulfillment accuracy best practices help connect those pieces and reduce rework.
This category is often the best place to watch customer-facing performance. It tells you whether the warehouse is both moving fast and finishing cleanly, which is the real goal.
Labor, equipment, and safety metrics
Labor, equipment, and safety metrics show whether the warehouse can keep performance steady without burning people or machines out. They also help you spot problems that can hurt output long before they become serious.
Track labor productivity, overtime hours, equipment uptime, downtime rate, incident rate, and near-miss reports. If you manage automation or forklifts, add preventive maintenance completion and equipment utilization as well.
Labor data tells you how well staffing matches demand. Too much overtime can point to poor planning, while low productivity can signal bad slotting, weak training, or too much walking. Equipment data shows whether machines are helping the flow or slowing it down.
Safety metrics deserve the same attention as output metrics. A warehouse can hit volume targets and still carry too much risk. Incident rates, near misses, and maintenance checks help leaders protect people while keeping operations reliable.
The best dashboards keep this group visible because it affects everything else. Healthy labor and equipment numbers support stable service, and safe work habits keep the gains in place.
Receiving KPIs that show how well inbound goods are handled
Inbound performance sets the tone for the rest of the warehouse. If receiving is slow, messy, or inaccurate, the damage shows up later in putaway, inventory counts, and order fulfillment. The right receiving KPIs help you see whether goods are moving off the dock at the right speed and in the right condition.

Strong inbound metrics also make labor planning easier. When you know how long trucks wait, how often ASNs match, and how fast stock reaches storage, you can spot bottlenecks before they slow the whole building. For operations that depend on tight control, this is where Indianapolis distribution center services often start showing value in day-to-day work.
Speed and accuracy at the dock
Receiving speed matters, but only when the dock is still accurate. A fast check-in means little if counts are off, labels are wrong, or product arrives damaged. The real goal is clean throughput, where goods move quickly and stay dependable.
The most useful KPIs here include dock-to-stock time, receiving accuracy, and receiving productivity. Dock-to-stock time shows how long it takes to receive, inspect, and store product. Receiving accuracy shows whether the item count, SKU, and paperwork match what arrived. Receiving productivity shows how much the team processes per labor hour.
These numbers work together. Short dock-to-stock time is good only when the team still counts correctly and catches issues early. High receiving productivity can also hide trouble if workers rush past mismatched labels or damaged cartons. That kind of speed just pushes errors downstream.
A practical view looks like this:
- Dock-to-stock time tells you how long inventory sits before it becomes usable.
- Receiving accuracy shows whether the system and the floor agree.
- Receiving productivity reveals how efficiently the team handles inbound volume.
- Putaway time shows how fast received goods reach their storage location.
Fast receiving without accuracy creates more work later, not less.
Putaway time matters for the same reason. If product sits on the dock too long, space gets crowded and pick faces stay empty. When putaway runs well, the warehouse has better visibility and less congestion at the receiving area.
Common inbound problems these KPIs expose
Receiving KPIs are useful because they surface the problems that are easy to miss in the moment. A dock can look busy and still run poorly if trailers arrive late, documents are missing, or goods keep coming in damaged.
ASN accuracy is one of the clearest warning signs. When advanced shipping notices do not match the freight, the team spends extra time checking, counting, and fixing records. That slows receiving and makes inventory data less reliable.
Trailer wait time is another important clue. Long waits often point to poor appointment timing, dock congestion, or slow unloading. If trucks stack up outside the building, the whole inbound flow gets harder to manage.
Inbound damage rate also deserves attention. A high rate can mean weak carrier handling, bad packaging, poor palletization, or rough unloading at the dock. It raises labor costs too, because damaged freight needs inspection, photos, claims work, and sometimes repacking.
Other problems these KPIs can uncover include:
- Missing paperwork that forces manual checks and delays.
- Late appointments that bunch arrivals into a short window.
- Mismatched ASNs that create extra counting and rework.
- Damage on arrival that blocks putaway and inventory release.
Together, these measures show whether inbound flow is healthy or just moving fast on paper. When they stay in range, the rest of the operation gets a cleaner start each day.
Inventory KPIs that protect stock accuracy and reduce waste
Inventory metrics tell you whether product is in the right place, in the right amount, and still worth holding. When those numbers slip, waste shows up fast, through missing stock, excess stock, damaged items, and shelves full of products no one needs yet.
The best inventory KPIs keep the operation practical. They help you answer simple questions every day, such as: Do we trust the count? Are we buying too much? Is product sitting too long? Are replenishment and slotting helping the floor, or creating extra work?

### Stock health and record accuracy
Stock health starts with clean records. If the system shows one number and the shelf shows another, every other decision gets weaker. You can’t plan labor well, order with confidence, or promise shipment dates when the base data is off.
Inventory accuracy is the first number to watch. It compares what the system says you have with what’s actually on hand. When accuracy is high, teams spend less time searching, customers see fewer shorts, and replenishment gets easier to manage.
Cycle count accuracy matters for the same reason, but it gives you a more focused view. It shows whether your count process is working on a regular basis, not just during a full physical inventory. If cycle counts keep missing the mark, the problem may be bad location control, poor scan discipline, or loose receiving habits.
A strong stock record also supports better supplier and order planning. When your data is clean, the warehouse can trust the numbers enough to act on them. That is why many teams pair inventory control with real-time inventory tracking services, especially when they need tighter visibility across receiving, storage, and replenishment.
A few signs point to poor stock health:
- Frequent system adjustments after counts
- Repeated order shorts on items that should be available
- Search time that keeps rising for common SKUs
- Inventory reports that no one fully trusts
Clean data is the base layer. Without it, the rest of the KPI dashboard becomes harder to read.
Signs that inventory is tying up cash
Inventory can look healthy on paper and still drain money every day. Slow-moving items take up space, aging stock loses value, and overbuying locks cash into product that should have moved weeks ago.
Aging inventory shows how long items have sat in the warehouse. The longer product stays on the floor, the more likely it is to become discounted, damaged, or obsolete. This is especially painful for seasonal goods, dated packaging, or products with short shelf lives.
Days on hand gives a clear view of how much inventory you’re carrying compared with demand. High days on hand may sound safe, but it often means too much capital is sitting in storage. That extra stock also raises handling costs, insurance exposure, and the chance of write-offs.
Inventory turnover helps show how often stock sells or moves through the warehouse over a set period. Healthy turnover means goods are moving at a steady pace. Low turnover is a warning sign that purchasing, forecasting, or slotting needs attention.
Overstock rate is another useful check. It shows how much inventory exceeds expected demand or storage targets. High overstock eats up space that could hold faster-moving items, and it can make the warehouse feel full even when sales are weak.
Slow stock does more than sit still, it crowds out the products that should be moving.
Shrinkage rate and write-off rate also matter here. Shrinkage covers lost, stolen, or unaccounted-for product. Write-offs cover inventory that can’t be sold at all, usually because of damage, spoilage, or obsolescence. Both metrics show real cost, not just inventory movement.
How replenishment and slotting affect daily flow
Replenishment and slotting shape the pace of the warehouse every day. When they work well, pickers spend less time walking and more time picking. When they fail, the floor fills with extra travel, empty pick faces, and avoidable delays.
Replenishment accuracy tells you whether pick locations get refilled with the right product and quantity at the right time. If replenishment misses, pickers waste time waiting for stock, or worse, they stop mid-shift because a location runs empty. That slows orders and creates pressure in the aisles.
Slotting accuracy shows whether SKUs are stored in the best location for their demand, size, and handling needs. A fast-moving item in a back corner adds unnecessary steps to every order. A heavy item placed too high or too far away adds strain and slows the team down.
Good slotting is about flow, not just storage. The right location cuts travel, reduces congestion, and keeps high-demand stock close to the action. Poor slotting does the opposite, and the waste shows up in both labor time and missed picks.
A simple way to compare the impact looks like this:
| KPI | What it protects | What goes wrong when it slips |
|---|---|---|
| Replenishment accuracy | Available pick stock | Empty pick faces and order delays |
| Slotting accuracy | Travel time and pick speed | Extra walking and slow fulfillment |
| Days on hand | Working capital | Cash tied up in excess stock |
| Write-off rate | Inventory value | Lost margin from unusable product |
When you track these together, the picture gets clearer. Replenishment keeps product available, slotting keeps it reachable, and turnover tells you whether the warehouse is holding the right amount in the first place.
The best warehouses use these KPIs to keep inventory clean and usable, not just counted. That means fewer surprises on the floor, less waste in storage, and better control over what stays on hand.
Picking and packing KPIs that shape order speed and accuracy
Outbound performance shows up in the numbers that touch the customer first. If picking is slow or packing is sloppy, orders leave late, costs rise, and service takes a hit. The right KPIs help you spot where time disappears and where mistakes start.
These metrics also show whether your process design matches the work. A strong team can still struggle if travel paths are long, slots are poor, or pack stations are set up badly. That is why speed and accuracy need to be measured together.

### Picking metrics that show travel, speed, and error rates
Pick rate tells you how much work a picker completes in a set time, usually in lines or units per hour. A strong rate can point to good slotting, short travel paths, and a smooth workflow. A weak rate often means the team is walking too far, waiting on stock, or stopping too often to fix issues.
The best pick metrics connect speed with quality. Lines picked per hour shows how many order lines a picker finishes, while units picked per hour shows total volume. Those two numbers are not the same, and that difference matters. A picker handling many small orders may look fast on lines but still move fewer units than someone pulling large cases.
Pick accuracy and mispick rate reveal the quality side of the process. A high mispick rate usually points to one of two problems, poor process design or weak training. If the same SKUs get picked wrong again and again, the layout, labeling, or location control is probably the issue. If errors vary by worker, the team may need better training or clearer scan checks.
Simple day-to-day clues help you read the numbers:
- A high pick rate with rising mispicks means speed is outrunning control.
- Low lines per hour with long travel time usually means slotting needs work.
- Low units per hour on large orders can point to poor batching or extra walking.
- Frequent order shorts often show up before customers complain.
When these KPIs are tracked together, they tell a clean story. You can see whether the warehouse needs better layout, stronger coaching, or both.
Packing metrics that protect the final order
Packing is the last quality check before shipment, so its KPIs carry real weight. Pack accuracy shows whether the right items, quantities, inserts, and labels make it into the final carton. When this number drops, you get more customer complaints, more returns, and more rework at the bench.
Packing productivity measures how many orders or cartons a packer completes in a given time. Good productivity keeps labor cost under control, but only if the team still packs correctly. Fast packing with bad checks just creates expensive cleanup later.
Rework rate is one of the clearest cost signals in this area. Every corrected carton adds labor, packaging material, and delay. It can also raise damage risk if boxes are opened and repacked more than once. That affects the customer too, because a reworked order often arrives later than promised.
Packing errors can be small and still cause big trouble. A missing insert might seem minor in the warehouse, but it can trigger a service call or a return. A wrong label can send the shipment to the wrong place. A damaged carton can turn into a claim before the customer even opens it.
A quick way to judge pack performance is to watch for these patterns:
- Pack accuracy drops when station checks are rushed.
- Rework rate rises when product details are unclear.
- Productivity looks good until labor costs jump from corrections.
- Customer complaints often lag behind the first spike in errors.
Packing speed only helps when the order stays right after the final check.
That is why pack metrics matter beyond the bench. They protect margin, reduce damage, and help the order land the way it should.
Order cycle time from release to shipment
Order cycle time tracks the full path from release to shipment, not just one task inside it. That wider view matters because a warehouse can post strong pick and pack numbers while still shipping late. One fast step does not fix a slow handoff.
This KPI shows how the operation flows as a whole. If picking is quick but staging is backed up, cycle time still slips. If packing runs smoothly but orders wait for labels or dock space, customers still feel the delay. In other words, end-to-end speed is what counts.
Cycle time also helps you find the real bottleneck. A delay that looks small at the pick station may actually come from release timing, batch waves, or packed-order staging. When you track the whole order path, the weak point becomes easier to see.
A healthy cycle time supports better promises to customers and better labor planning inside the building. It also gives managers a clearer way to compare busy days with normal ones. If volume rises but cycle time stays stable, the warehouse is handling the load well. If cycle time climbs at the same volume, the process is wearing thin.
The most useful view is simple:
- Pick rate shows how fast work starts.
- Pack accuracy shows how clean the order stays.
- Order cycle time shows how quickly the order leaves the warehouse.
- Order completeness shows whether the customer gets the full shipment without a follow-up.
When these metrics move together, fulfillment feels smooth to the customer and controlled to the team. When one slips, the rest usually follow.
Shipping and service KPIs that tell you if customers get what they expect
Shipping performance is where warehouse work meets the customer. Pick speed, pack quality, carrier handoff, and delivery accuracy all show up here, so these KPIs matter just as much as internal efficiency metrics.
The best shipping metrics do more than track motion. They show whether you shipped the right order, on time, in good condition, and at a cost that still protects margin. When these numbers stay strong, complaints drop and revenue is easier to keep.

### How to measure on-time performance the right way
On-time performance sounds simple, but the definition changes the result. Shipping on time means the order left the warehouse by the promised cutoff. Delivering on time means the carrier brought it to the customer when expected. Meeting promised service levels covers both, plus any rules tied to your order promise, transit class, or fulfillment window.
That difference matters. A warehouse can ship on time and still miss the customer promise if the carrier is delayed. It can also deliver on time after a late ship if transit runs unusually fast. For most operations, the real KPI is whether the customer got the service level they expected, not just whether the box left the dock.
Track these measures separately so you can spot where the delay starts:
- On-time ship rate shows whether orders leave within the promised window.
- On-time delivery rate shows whether the carrier meets the final promise.
- Fulfillment SLA compliance shows whether the full service standard was met, including timing and order accuracy.
If on-time ship rate is strong but delivery slips, the issue may sit with carrier selection, cutoff times, or tender timing. If SLA compliance falls while ship rate stays high, the warehouse may be missing packing rules, label steps, or special handling requirements. In short, this KPI set tells you whether the operation kept its word all the way through.
For tighter shipping control, reducing time from order to carrier pickup can help connect warehouse timing with final ship performance.
Perfect order rate as a top-level scorecard
Perfect order rate brings the big picture into one number. It combines accuracy, speed, and condition, which makes it one of the clearest views of customer experience.
A perfect order is shipped on time, contains the correct items and quantities, and arrives without damage or missing pieces. If any part fails, the order is no longer perfect. That makes the metric strict, but useful. It does not let a fast ship hide a wrong item, and it does not let a correct order hide a late departure.
This KPI is powerful because it mirrors how customers judge you. They don’t care that the order was packed quickly if it arrived broken. They don’t care that the items were correct if the shipment missed the promised date. They care about the full result.
A strong perfect order rate usually reflects solid work across the warehouse:
- Receiving catches errors before inventory is stored.
- Picking pulls the right SKU and quantity.
- Packing protects the product and confirms the order details.
- Shipping sends the right carton at the right time.
- Delivery completes the promise without exceptions.
Perfect order rate is one of the fastest ways to see whether your process works as a whole.
If this metric drops, the cause is often hiding in more than one place. One team may be missing labels, while another is shipping damaged cartons or late loads. That is why this KPI is best used as a scorecard, then paired with supporting metrics to find the weak link.
What freight and damage numbers can reveal
Freight cost per order and damage rates tell you whether the warehouse is protecting product and margin at the same time. When shipping costs creep up, or damage claims rise, the problem is often more basic than carrier rates. Packaging, pallet build, handling, and load planning can all drive those numbers.
Freight cost per order helps you see whether shipping expense is growing faster than volume. If cost rises while order size stays flat, the issue may be poor carton selection, low load utilization, or too many split shipments. If cost spikes on certain lanes, the carrier mix or freight class may need attention.
Load utilization shows how much space you use in a trailer or container. Better utilization usually lowers cost per order because you move more product in fewer trips. Poor utilization can point to bad cube planning, awkward carton sizes, or rushed staging that leaves unused space on the truck.
Outbound damage rate is just as telling. A rising damage rate often points to weak packaging, loose pallet wrapping, unstable stacks, or rough dock handling. It can also reveal a mismatch between the product and the packaging format. A fragile item needs different protection than a durable one.
When those numbers move together, the pattern is hard to ignore. Higher freight cost plus more damage often means the same root problem is hitting twice, once in the lane and once in the box. A few common warning signs are easy to spot:
- More claims after a change in carton size or fill material.
- Higher freight cost after load plans become less dense.
- Damage on specific SKUs that need better cushioning or labeling.
- More rework when cartons arrive crushed or pallets shift in transit.
If delivery exceptions rise too, the picture gets even clearer. Delivery exception rate tracks failed deliveries, missed appointments, refused freight, or any shipment that needs manual follow-up. A high rate can point to bad address data, poor carrier handoff, late departure, or damage that stopped the load from being accepted.
These shipping KPIs tie the warehouse directly to the customer experience. They show whether the order arrived as promised, in good shape, and at a cost that still makes sense. Strong results here protect revenue, reduce complaints, and keep the last mile from undoing all the work that came before it.
For teams that want tighter fulfillment oversight, standardizing order accuracy and shipping timelines can help bring service, cost, and customer expectations into one view.
Labor, equipment, and safety KPIs that keep operations stable
Labor, equipment, and safety numbers tell you whether the warehouse can hold its pace day after day. Strong output means little if the team is exhausted, the trucks are idle, or injuries keep pulling people off the floor. These KPIs help you protect the work, the people, and the schedule at the same time.
A warehouse runs best when people, machines, and safe habits stay in balance. If one area slips, the rest usually follows. That is why this group belongs near the center of any serious KPI dashboard.

### Labor productivity without burning people out
Labor productivity shows how much useful work the team completes in a shift. Order lines per labor hour is one of the clearest ways to measure it, because it ties output directly to paid time. When that number rises for the wrong reasons, though, the team may be pushing too hard or skipping needed checks.
That is why productivity should never sit alone. Labor utilization shows how much of the paid time is spent on productive work. Overtime rate reveals whether the team is covering demand with extra hours instead of better planning. Absenteeism rate shows how often staffing gaps are forcing the rest of the crew to absorb more work.
Together, these numbers paint a real picture:
- High productivity with high overtime can mean the team is carrying too much load.
- High utilization with low output often points to poor slotting, too much walking, or rework.
- Rising absenteeism can signal burnout, weak scheduling, or morale issues.
- Flat productivity after training may mean the process, not the people, needs attention.
A healthy operation does not squeeze every last minute out of the shift. It keeps output steady enough that people can work well tomorrow too.
Warehouse management system tools for labor productivity also matter here, because real-time data makes it easier to match staffing to the work that is actually happening.
Equipment uptime and daily reliability
Broken equipment slows everything around it. A dead conveyor, a down scanner, or a forklift that waits on repairs creates more than one delay, because workers stop, orders stack up, and managers start shifting labor just to keep the floor moving.
Equipment uptime shows how much of the scheduled time a machine is ready to work. Downtime rate shows the opposite, and both are useful because they point to lost capacity. Forklift utilization adds another layer, since too little use can mean idle assets, while too much use can mean the fleet is stretched thin.
Daily reliability matters because small breakdowns create hidden costs. A truck may still leave on time, but only after extra handling, longer travel, or temporary labor changes. Those workarounds cost money and wear people out.
A few clear warning signs are easy to watch for:
- Repeat repairs on the same unit
- Delayed picks because mobile equipment is unavailable
- Extra labor spent moving stock by hand
- Missed tasks during peak hours
Uptime problems rarely stay inside one process. They spread into labor, shipping, and service levels fast.
Good equipment tracking helps you separate a one-off repair from a real pattern. If one forklift keeps failing, the warehouse loses time, money, and trust in the flow. If uptime stays strong, the whole building feels easier to run.
Safety numbers that protect people and output
Safety KPIs do more than prevent injuries. They protect output by keeping people on the floor, lowering disruption, and reducing turnover. A warehouse with frequent incidents loses time in all the wrong places, from paperwork and cleanup to retraining and schedule changes.
Track incident rate, near-miss rate, and lost-time injury rate first. Incident rate shows how often recordable injuries happen. Near-miss rate helps you catch hazards before someone gets hurt. Lost-time injury rate shows how often injuries are serious enough to pull someone off the job.
Training matters here too. Training completion tells you whether employees have finished the safety and task training they need before working independently. That number matters because untrained workers make mistakes faster, and mistakes on the warehouse floor can shut down a lane, a dock, or a whole shift.
These metrics protect both people and output because they reduce the common causes of disruption:
- Fewer injuries mean fewer gaps in labor coverage.
- More near-miss reporting means hazards get fixed earlier.
- Better training lowers mistakes with equipment, stacking, and movement.
- Lower turnover keeps knowledge on the floor instead of walking out the door.
A safe warehouse is usually a more stable warehouse. People work with more confidence, managers spend less time chasing disruptions, and the operation keeps its rhythm. Strong safety data keeps the whole system steady.
How to turn warehouse KPIs into action instead of just reports
Warehouse KPIs only matter when they change behavior. A dashboard that gets reviewed and ignored is just wall art with numbers on it. The real value comes when every metric has a target, an owner, and a next step.
That shift starts with a simple habit, compare actual results to a clear goal, then ask what needs to happen before the next review. If the answer is always “nothing,” the KPI is not doing useful work.

### Set the right target for each metric
Every warehouse metric needs a target, but the target has to mean something. Industry benchmarks give you a general reference point, internal goals reflect your operation’s real needs, and stretch goals push the team to improve without breaking the process.
Benchmarks are useful when you want to know where you stand. They help you see if your pick rate, inventory accuracy, or dock-to-stock time is in a normal range. Still, they should not be treated like a finish line. A warehouse with older equipment, a different product mix, or a more complex order profile may never match a broad benchmark exactly.
Internal goals are more useful day to day. These targets should match your own volume, staffing, service promise, and customer mix. If your team ships same-day orders, your on-time shipment target should reflect that reality. If your operation handles many small SKUs, your picking target should account for the extra travel and count checks.
Stretch goals belong one step higher. They should be hard enough to create progress, but not so high that the team stops trusting the numbers. A good stretch goal gives leaders a reason to improve layout, training, or process design.
A simple target framework works well:
- Use the benchmark to see what good looks like outside your warehouse.
- Set the internal goal based on your current process and customer promise.
- Add a stretch goal that forces improvement without creating noise.
When a KPI misses target, the question should not be “How do we explain it?” It should be “What do we change next?”
Use trends, not one bad day, to guide decisions
One bad day can fool you. A late truck, a system outage, or a sick crew can drag down a KPI without pointing to a real problem. Trends matter more because they show whether the issue is random or repeated.
Look at the last few weeks, not just the last shift. If order accuracy dips once and rebounds, you may have a one-off event. If it slips three Fridays in a row, you probably have a staffing, training, or workflow issue. That pattern tells you where to dig.
Trend lines also help you spot slow decline before the damage gets bigger. A warehouse can miss its target by only a small amount for several weeks and still create a serious service problem. By the time the monthly report looks bad, the root cause may have been building for some time.
A useful review habit is to ask three questions:
- Is this number moving up, down, or flat?
- Is the pattern tied to a shift, zone, product group, or day of week?
- Did the change start after a process change, new hire, or volume spike?
A single number can mislead you. A pattern tells you where the work needs attention.
This is also where a good system matters. If you want faster action on warehouse data, warehouse automation technologies guide can help tie KPI tracking to cleaner flow and better visibility.
Build a simple review rhythm that your team will actually use
The best KPI process is the one people can keep up with. If the review takes too long, happens too late, or feels too formal, the numbers stop driving action. Keep the rhythm simple and repeat it.
Start with daily meetings. Use them to scan the few metrics that can change work today, such as order accuracy, labor productivity, dock delays, or backlog. Keep the discussion short, focused, and tied to the current shift. If a KPI is off, assign one owner and one next step before the meeting ends.
Use weekly reviews for patterns and root causes. This is the right time to compare actual results to goals, check recurring misses, and decide whether the fix is working. Weekly reviews should look for process issues, not just blame. If mispicks keep happening in one zone, the answer may be slotting, labeling, or retraining.
Reserve monthly planning for bigger decisions. That is where you review trends, reset targets if needed, and decide whether staffing, layout, systems, or equipment need a change. Monthly is also the right time to remove vanity metrics. If a number does not lead to a decision, it doesn’t belong on the main dashboard.
A focused review cadence can look like this:
| Cadence | What to review | Main outcome |
|---|---|---|
| Daily | Service, exceptions, backlog, labor output | Fix today’s problems |
| Weekly | Trends, misses, root causes | Adjust the process |
| Monthly | Targets, staffing, layout, capital needs | Plan bigger changes |
Give each metric an owner, too. The owner does not have to fix everything alone, but someone has to track the number, raise the issue, and push the follow-up. Without ownership, KPI reviews turn into talk.
The best dashboards stay lean. They show a few numbers that matter, a clear target for each one, and a visible path to action. That is how warehouse KPIs stop being reports and start improving the floor.
Conclusion
The strongest warehouse KPIs do one job well, they give clear answers about speed, accuracy, cost, labor, and service. When you watch the right numbers, you can spot problems early and fix them before they spread through the operation.
The goal is not to track every metric you can find. It’s to track the ones that help your team work better each day, then use the results to improve the floor, not just the report.
Start with a small dashboard, check trends often, and update the metric list as the operation grows. That keeps the focus on what matters most, and it makes warehouse performance easier to manage with confidence.
