

How to Calculate Contract Packaging ROI
A lower quoted unit price doesn’t automatically mean contract packaging will improve your bottom line. Outsourcing can reduce operating costs, increase capacity, and improve service, but the comparison only works when you measure your fully loaded in-house cost against the full outsourced cost.
Your in-house figure should include more than wages. Add benefits, supervision, floor space, equipment, maintenance, overtime, rework, waste, quality issues, inventory handling, and the cost of disruptions when volume changes. Then compare that total with the provider’s price, freight, storage, quality checks, materials, and any other added charges. A partner offering contract packaging services may also help reduce fulfillment delays or avoid investments in equipment and temporary labor.
This guide shows how to calculate contract packaging ROI using cost per sellable unit, transition expenses, recurring operational savings, and payback period. A worked example will show how to turn those figures into a practical outsourcing decision for manufacturers, ecommerce brands, distributors, and retail suppliers. First, establish an accurate baseline for what each sellable unit costs your business today.
Key Takeaways
- Calculate contract packaging ROI using total cost of ownership, not the provider’s quoted unit price alone.
- Include labor, benefits, supervision, floor space, equipment, maintenance, waste, rework, quality failures, storage, and management time.
- Add outsourced costs such as packaging fees, materials, freight, storage, quality checks, and transition expenses.
- Compare total cost per sellable unit, then calculate net benefit, ROI percentage, and payback period.
- Review safety, accuracy, cycle time, and service data because fewer disruptions can protect output and improve the financial return.
Why Contract Packaging ROI Is More Than a Lower Unit Price
Contract packaging ROI measures the financial return from outsourcing compared with keeping the work in-house. A vendor quote is only one input. It may show a lower processing price while leaving freight, storage, quality checks, transition costs, or material handling outside the calculation.
The strongest comparison uses your fully loaded cost per sellable unit. That figure reflects what you can actually ship and sell after scrap, rework, damage, product holds, labeling errors, and downtime. A processed unit that fails inspection has little financial value.

### Separate savings from the other sources of ROI
Price savings reduce the cost of work you already perform. For example, a provider may lower labor, equipment maintenance, overtime, or packaging material costs. Cost avoidance is different. It includes capital spending you no longer need, such as a new packaging line, extra warehouse space, or seasonal hiring.
Added revenue can also affect the calculation. Faster packaging may help you launch a product sooner, fulfill a retail promotion, or accept orders your current line cannot handle. Capacity gains create value when they free employees, floor space, or equipment for higher-margin production.
Risk reduction belongs in the model as well. Fewer labeling mistakes, damaged cartons, safety incidents, retailer chargebacks, and missed shipping windows can protect revenue that a unit-price comparison never shows.
A lower fee per processed unit can still produce a weaker return if the arrangement creates more damage, freight, rework, or idle inventory.
Use sellable units, not processed units
Calculate total packaging cost by dividing all relevant costs by the number of units that pass inspection and become available for sale. Include labor, materials, freight, storage, quality checks, waste, rework, damage, and downtime.
This method gives you a fair basis for comparing in-house operations with outsourced contract packaging. It also makes provider performance easier to monitor through accuracy, cycle time, safety, and on-time completion metrics.
When outsourcing may produce stronger returns
Contract packaging often fits well when demand changes faster than your workforce or equipment can respond. Common triggers include:
- Seasonal peaks that require temporary capacity.
- Labor shortages or rising overtime.
- New product launches and promotional programs.
- Additional SKUs, bundles, or retailer-specific pack-outs.
- Specialized packaging that requires equipment or trained operators.
Reported savings of 15% to 25% can provide a useful benchmark in well-matched situations. Actual ROI depends on volume, process complexity, service scope, quality requirements, and your current operating costs. Use the benchmark as a starting point, then build the decision around your own sellable-unit data.
How to Calculate the ROI of Contract Packaging
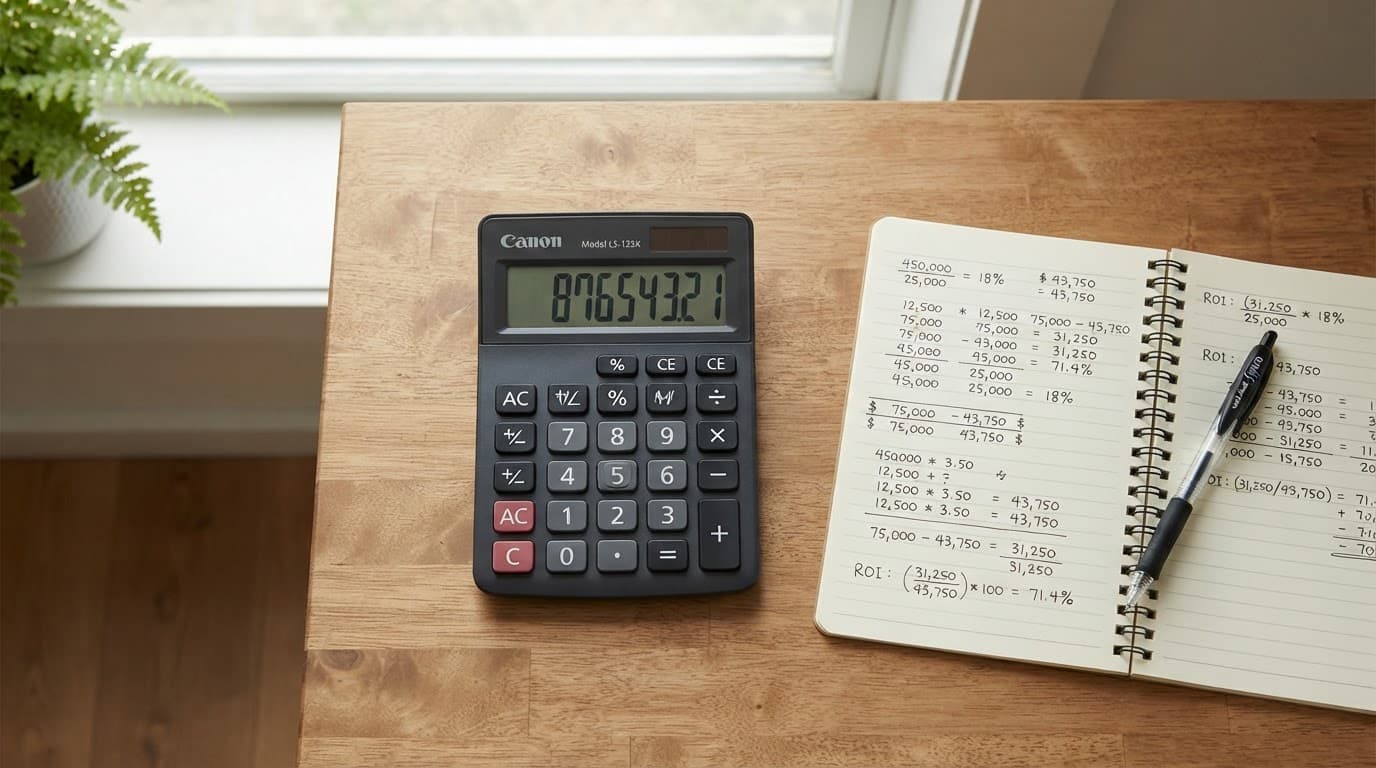
Start with a matched before-and-after comparison. Use the same 12-month period, annual unit volume, product mix, packaging formats, quality standards, and service scope on both sides. Then separate recurring operating costs from one-time transition expenses.
### Set a Clear Time Period and Volume Baseline
A 12-month baseline captures normal demand, seasonal peaks, promotions, and slower periods. Break the annual forecast into monthly units instead of dividing one yearly estimate evenly across every month. Include expected growth, new SKUs, retail programs, and temporary volume increases.
Compare the same annual units and product mix with both in-house and outsourced packaging. If the in-house model includes a promotional bundle, the contract packaging model must include that bundle too. Otherwise, the result compares two different operations.
A high-volume forecast can make outsourcing look unusually attractive because fixed in-house costs spread across more units. If demand falls, those costs remain while the cost per sellable unit rises. On the other hand, a low-volume estimate may hide the value of flexible capacity, especially when outsourcing prevents overtime, temporary hiring, or new equipment during peak months.
For a closer look at the trade-offs, review this guide to contract packaging versus in-house costs.
Choose Cost per Sellable Unit as the Main Comparison
Use sellable output as the denominator:
Cost per sellable unit = Total packaging cost / Sellable units
Count only units that pass inspection and are ready to ship. Produced units can include scrap, damaged goods, rework, quality holds, missing components, and packaging errors. These losses affect the real cost, so excluding them can make an inefficient process appear cheaper.
Track the result by SKU or packaging format when labor, materials, setup time, or inspection requirements differ. A simple outsourced packaging fee may look favorable overall while a difficult SKU creates most of the rework.
For the full ROI calculation, use:
ROI = (Total benefits - Total costs) / Total costs x 100
In an outsourcing model, annual net benefit starts with fully loaded in-house cost minus ongoing outsourced cost. Subtract one-time transition costs, such as testing, line setup, tooling, inventory transfers, and training, where appropriate. Ongoing vendor costs include packaging fees, materials, freight, storage, quality checks, and other agreed charges.
Payback uses a separate measure:
Payback period = Transition investment / Monthly net benefit
Savings are estimates, not guarantees. Validate the model with actual volumes, provider pricing, quality data, and a realistic ramp-up schedule.
Build the Fully Loaded In-House Packaging Cost
Your baseline should show what each sellable unit costs, not what your line spends on wages and materials alone. Pull actual figures from payroll, purchasing, maintenance, finance, quality, warehouse, and transportation records. Then divide the annual total by units that pass inspection and are ready to ship.

### Labor, Equipment, Space, and Overhead Costs
Start with loaded labor. Add wages, payroll taxes, benefits, shift premiums, overtime, temporary labor fees, recruiting, onboarding, and training time. Include supervisors, internal technicians, planners, warehouse staff, and managers who schedule work or resolve production issues.
Equipment costs include depreciation, financing or lease payments, maintenance parts, outside contractors, internal technicians, inspections, software, and utilities. Record setup and line changeover time separately. A line that spends an hour changing formats or waiting for materials has lower productive capacity, even when operators remain on payroll.
Floor space also carries a cost. Allocate rent or lease expense based on the square footage used for packaging lines, staging, component storage, work-in-process, and finished goods. Add facility utilities, insurance, cleaning, security, property taxes, and shared warehouse overhead. Inventory carrying costs belong in the model too, including capital tied up in packaging materials and finished stock.
Demand swings can raise the average cost through overtime, temporary hiring, expedited materials, idle equipment, and underused space during slower months. Review monthly data instead of applying one annual average to every period.
| Cost area | Records to review |
|---|---|
| Labor and training | Payroll, HR, timekeeping |
| Equipment and utilities | Fixed assets, maintenance, utility bills |
| Space and inventory | Finance, leases, warehouse records |
| Management and support | Labor reports, purchasing, scheduling |
For context, compare this complete baseline with outsourced packaging cost savings rather than a vendor’s processing fee alone.
Waste, Rework, Quality, and Service Costs
Quality records should capture scrap materials, rejected units, missing components, incorrect labels, damaged cartons, rework hours, inspections, compliance records, audits, product holds, returns, and retailer chargebacks. Transportation and customer-service records can reveal damage claims, reshipments, credits, and delayed orders.
Assign each event a dollar value. Include lost materials, labor consumed, freight, disposal, administrative time, and delayed revenue. A process with low direct labor can still cost more when errors create repeated handling or missed shipping windows.
The real baseline is the cost of producing a unit customers can receive and use, not the cost of touching it once.
Calculate the Full Cost of the Contract Packaging Option
A contract packaging quote only supports a reliable ROI calculation when it matches your current in-house scope. Request an itemized proposal that separates receiving, storage, materials, kitting, assembly, labeling, inspection, palletizing, outbound handling, freight, setup, tooling, rush work, and reporting. Each service should have a clear unit, rate, and assumption.

### Separate One-Time Transition Costs from Ongoing Fees
One-time costs affect cash flow immediately, even when you spread them across the analysis period for ROI. Include trial runs, packaging redesign, artwork changes, samples, testing, line validation, tooling, training, system integration, data setup, project management, freight to the provider, inventory transfers, and temporary dual operations while both sites run.
For example, if transition costs total $24,000 and your analysis covers 24 months, assign $1,000 per month to the ROI model. Still show the full $24,000 as a first-year cash requirement. This prevents a project from looking profitable on paper while creating a cash shortfall during implementation.
Ask the provider to identify whether each charge is fixed, volume-based, or triggered by a change in scope. Also confirm who pays for packaging redesign, validation failures, replacement samples, and unused materials if the project changes.
Check the Quote for Hidden or Variable Charges
Use an itemized comparison when reviewing contract packaging cost breakdowns. Ask about minimum order quantities, storage by pallet or location, receiving and inspection fees, material markups, order changes, rework, disposal, special labeling, freight accessorials, rush charges, and seasonal labor.
Pricing may also change when volume, SKU count, changeovers, or packaging complexity changes. Request tiered rates, minimum-volume assumptions, annual increases, storage-rate adjustments, and the written process for change orders. Ask for a sample invoice so you can see how charges appear after the work is complete.
Compare every quote using the same quality standard, delivery promise, reporting requirements, and sellable-unit definition. A cheaper rate with fewer inspections or slower outbound handling is not an equal option. Your final model should show the base fee, variable charges, transition costs, expected volume, and a reasonable allowance for exceptions.
Add the Benefits That Do Not Appear on the Quote
The quote shows what the provider charges. Your ROI model should also show what the arrangement helps you avoid, recover, or improve. These benefits can include released capacity, faster launches, fewer returns, better inventory accuracy, lower working capital, and less management time.
Separate verified savings from strategic benefits. Use company records for hard-dollar estimates, then show uncertain gains in a separate scenario rather than presenting them as guaranteed savings.

### Value Capacity and Revenue Carefully
Unused internal capacity has no financial value by itself. It creates value only when your business uses the released labor, floor space, or equipment for profitable production, faster fulfillment, or new customer orders.
For example, if outsourcing frees 1,000 labor hours, don’t automatically count those hours as both labor savings and added capacity. Those are the same hours. Count the benefit once, based on how the business will use them. If the hours support additional production, estimate the contribution margin, not total sales.
Incremental value = Additional sellable units x Contribution margin per unit
Contribution margin subtracts variable costs, such as materials, commissions, and outbound freight, from revenue. If released capacity supports $100,000 in sales but produces a 25% contribution margin, the incremental value is $25,000, not $100,000.
The same approach applies to faster launches and demand spikes. Use documented launch dates, expected order volume, margin, avoided overtime, or the cost of temporary labor. Include equipment and permanent headcount that the business can defer, but don’t count capacity until a real operating need exists. For more context, review these contract packaging service benefits.
Measure Quality, Service, and Risk Improvements
Track the operational measures that affect cash and customer service:
- Order accuracy, damage rate, scrap rate, rework hours, and return rate.
- On-time shipment rate, inventory accuracy, and retailer chargebacks.
- Management hours spent on scheduling, corrections, audits, and escalations.
- Safety incidents, near misses, lost-time injuries, and training completion.
Convert each improvement using historical costs. A lower damage rate can equal avoided replacement freight and credits. Fewer chargebacks can equal the prior average chargeback cost multiplied by the reduction. Improved inventory accuracy may reduce emergency replenishment and excess safety stock, which lowers working capital.
Fewer errors also protect output by reducing cleanup, retraining, schedule changes, and production interruptions. However, compliance protection and demand flexibility may remain uncertain. Show those benefits separately, use conservative assumptions, and report verified savings alongside strategic risk reduction rather than combining both into one inflated figure.
Work Through a Contract Packaging ROI Example
A simple fictional example shows how the numbers connect. Replace every assumption with verified data from your own operation, provider quote, payroll records, freight invoices, and quality reports.

### Show the Formula with Annual Dollars
Assume the following:
- Annual volume is 5 million sellable units.
- Fully loaded in-house cost is $0.42 per sellable unit.
- The contract packer’s processing rate is $0.34 per unit.
- Recurring outsourced storage, freight, and service charges total $150,000 per year.
- One-time transition investment totals $60,000.
Calculate each amount in sequence:
- Annual in-house cost: 5,000,000 units x $0.42 = $2,100,000.
- Annual outsourced cost: 5,000,000 units x $0.34 = $1,700,000, plus $150,000 in recurring charges = $1,850,000.
- Gross annual savings: $2,100,000 – $1,850,000 = $250,000.
- First-year net benefit: $250,000 – $60,000 transition investment = $190,000.
- First-year ROI: $190,000 / $60,000 x 100 = 316.7%.
- Months to payback: $60,000 / ($250,000 / 12) = 2.9 months.
The first-year ROI uses the transition investment as the initial cost. For later years, the one-time investment drops out, so recurring savings become the main benefit.
Run Sensitivity Scenarios Before Making a Decision
The expected case is only one view. Test reasonable changes to volume, labor rates, scrap, storage, freight, vendor pricing, and launch timing.
| Scenario | Main assumptions | Annual savings |
|---|---|---|
| Best case | 5.5 million units, lower scrap, standard freight | $350,000 |
| Expected case | 5 million units and quoted recurring charges | $250,000 |
| Conservative case | 4 million units, added storage and freight, slower launch | $70,000 |
In the conservative case, the $60,000 transition investment leaves only $10,000 in first-year net benefit. Payback also stretches to about 10.3 months, based on $70,000 in annual savings.
A decision is stronger when it remains financially sound under reasonable downside assumptions. If a modest volume decline or added freight charge eliminates the return, review the contract terms, minimums, storage rates, and launch schedule before approving the change.
Validate the Numbers with a Pilot and a Fair Vendor Comparison
A spreadsheet can estimate contract packaging ROI, but a 60- to 90-day pilot can test whether the assumptions hold in daily operations. Use a trial run, limited SKU transfer, or defined production volume before moving the full program. Agree on success criteria before the first unit runs, then compare actual results with the model.

### Use the Same Scorecard for Every Provider
Compare at least two providers when practical, and ask each one to price the same operation. Every quote should use the same volume, SKU mix, packaging steps, service levels, materials, delivery assumptions, and quality requirements. Otherwise, the lowest quote may simply exclude work that another provider included.
A practical scorecard should cover:
- Total price, including setup, storage, materials, freight, minimums, and change-order charges.
- Scope, quality controls, compliance support, capacity, lead time, and scalability.
- Technology, inventory visibility, reporting, traceability, location, and freight impact.
- Service levels, contingency plans, communication, and response time when issues occur.
Score each category using a consistent scale, then weight the factors that affect your operation most. A provider with a slightly higher fee may produce a better ROI if it reduces damage, rework, expedited freight, or retailer complaints. This contract packaging partner checklist can help organize questions about capability, quality systems, capacity, and pilot support.
Track Results After the Contract Starts
ROI needs a monthly review after implementation. During the pilot and early production, compare actual versus modeled cost per sellable unit, savings, throughput, labor hours, scrap, rework, damage, order accuracy, on-time shipment, inventory accuracy, and customer or retailer issues.
Assign an owner to each metric. Review weekly exceptions and monthly trends, then investigate variances instead of changing the model to hide them. A rise in damage may point to pack-out or freight problems, while lower throughput may reflect setup time, training, or an inaccurate volume assumption. Safety data also matters because incidents, near misses, lost-time injuries, and incomplete training can reduce available labor and disrupt output.
Ask providers how they handle SLAs, reporting, scan verification, lot or batch traceability, technology failures, capacity shortages, contingency plans, change orders, and contract amendments. The final agreement should document pricing, scope, ownership, quality standards, service levels, reporting, and a process for mutually approved written revisions. That record keeps the ROI model tied to the operation it measures.
Avoid the Mistakes That Distort Contract Packaging ROI
A contract packaging ROI model can look precise while using weak assumptions. The most common error is comparing a vendor’s base rate with an incomplete in-house cost. That approach may favor outsourcing before you account for the full operating picture.

### Use the Same Scope and the Same Unit
Start with the same packaging steps on both sides. Include labor, supervision, equipment, floor space, maintenance, materials, quality checks, waste, rework, management time, and inventory handling in the in-house baseline. Then add the provider’s packaging fee, freight, storage, receiving, setup, materials, inspection, and change-order charges.
Count sellable units, not production units. Scrap, damaged goods, missing inserts, labeling errors, and quality holds reduce usable output. Dividing costs by every unit that entered the line can make a high-error process appear cheaper.
Transition expenses create another common blind spot. Include testing, tooling, artwork changes, training, system setup, inventory transfers, launch freight, and temporary dual operations. Show these costs separately from recurring fees so you can see both the first-year cash requirement and the long-term return.
Test Revenue, Volume, and Cost Assumptions
Don’t count projected revenue as guaranteed ROI. If outsourcing creates capacity for additional orders, use the contribution margin from documented sales opportunities. Keep uncertain revenue in a separate scenario, and avoid assigning sales growth entirely to packaging when pricing, distribution, promotions, or seasonality also changed.
Seasonal demand needs a monthly model. A 20% volume drop can raise unit costs because fixed overhead spreads across fewer sellable units. A peak can create overtime, temporary labor, rush freight, or delayed shipments. Also test higher labor rates, material increases, storage charges, and provider price adjustments.
A cheaper packaging option can cost more when quality failures trigger returns, retailer chargebacks, replacement freight, delays, and customer complaints.
Check Service and Quality Differences Before Signing
Compare damage rates, order accuracy, rework, on-time shipment, inventory accuracy, safety performance, and training completion. A provider that ships faster with fewer errors may produce a better return than one with the lowest processing fee.
Before signing, confirm that you have:
- A complete in-house baseline.
- Matching scope and sellable-unit definitions.
- All recurring and transition costs.
- Tested volume, labor, freight, and material assumptions.
- Best-case, expected, and downside scenarios.
- Written success metrics, service levels, reporting, and amendment procedures.
Frequently Asked Questions
These questions address practical issues that often remain after you build a contract packaging ROI model. For a basic explanation of what contract packaging involves, start with the service scope before comparing costs.

### What is a good ROI for contract packaging?
There is no universal target. Volume, labor rates, capital needs, quality risk, service goals, and provider scope can change the result substantially. Compare ROI with payback period, first-year cash flow, quality performance, and the value of added capacity. A high percentage means less if the project creates cash pressure or fails to support reliable output.
Should I compare contract packaging by price per unit?
Price per unit is only a starting point because quotes may exclude important charges. Calculate total cost per sellable unit after adding materials, receiving, storage, freight, quality work, rework, scrap, and transition costs. Also check minimums, changeovers, rush fees, and accessorial charges. The lowest quoted rate may produce the highest final cost.
How do I include one-time setup costs in the ROI calculation?
Place setup costs in the investment or transition-cost portion of your model. Include testing, tooling, artwork changes, training, inventory transfers, system setup, and temporary dual operations when applicable. Show the full amount as a first-year cash expense, then amortize it across the analysis period for a longer-term comparison.
How long should I measure contract packaging ROI?
Use a 12-month model for the first comparison because a full year captures seasonality, volume changes, and recurring charges. When possible, follow it with a 60- to 90-day pilot to test quality, throughput, freight, and actual billing. The pilot validates assumptions, while the annual model provides a fairer financial view.
What if outsourcing improves capacity but does not lower costs?
Released capacity can still create value when it supports profitable production, faster launches, better service, or avoided equipment spending. Calculate added contribution margin or documented avoided costs, not projected sales alone. If the freed labor, space, or equipment has no practical use, leave that capacity out of the financial benefit.
What information should I give a contract packager for an accurate quote?
Provide product dimensions and weights, annual and monthly volumes, SKU count, packaging steps, materials, quality standards, labeling, storage needs, inbound and outbound flows, target dates, service levels, and expected growth. Include special handling, seasonal peaks, and retailer requirements when relevant. Complete information produces a more useful quote and reduces surprise charges after launch.
Conclusion
Contract packaging ROI comes from a complete, fair comparison, not a quick look at the vendor’s unit price. Start with a fully loaded in-house baseline that includes labor, supervision, equipment, space, materials, waste, rework, quality failures, and management time. Then price the full outsourced scope, including packaging fees, materials, freight, storage, inspections, variable charges, and any residual internal costs.
Add one-time transition expenses separately, then quantify valid operational benefits such as released capacity, avoided capital spending, fewer errors, lower damage and return costs, and faster fulfillment. Use those figures to calculate total cost per sellable unit, annual net benefit, ROI, and payback period. Keep projected revenue and other uncertain gains in separate scenarios.
Finally, test the model with conservative volume, freight, labor, quality, and pricing assumptions. A pilot can show whether the provider meets the expected cost, accuracy, safety, throughput, and service targets. Continue reviewing those KPIs after launch so the financial model stays connected to actual results. The right partner delivers reliable quality, flexible capacity, and dependable service alongside financial value. That is what makes contract packaging a sound operating decision rather than a short-term price comparison.
